- Messages and
Profiles - Business
Model - Management
Discussion and
Analysis - Stewardship
- Integrated Risk Management
- Corporate Governance
- Annual Report of the Board of Directors on the Affairs of the Bank
- Report of the Audit Committee
- Report of the Human Resources and Remuneration Committee
- Report of the Nomination Committee
- Report of the Board Integrated Risk Management Committee
- Directors’ Statement on Internal Control
- Independent Assurance Report
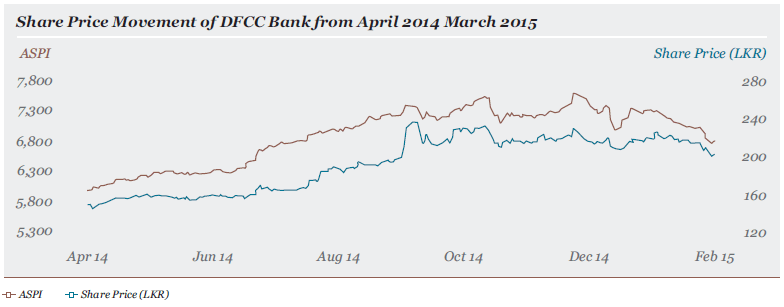
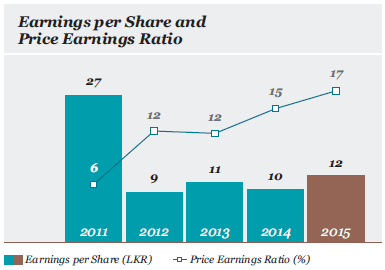
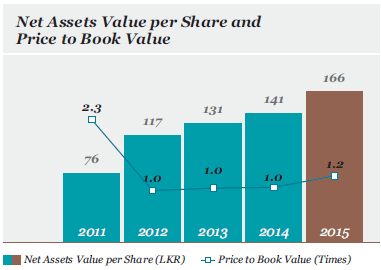
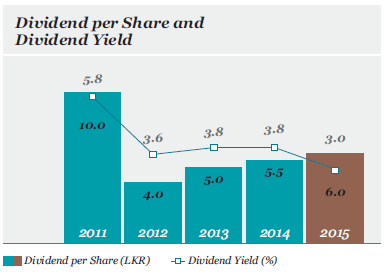
- Investor
Relations - Financial
Reports- Financial Calendar
- Statement of Directors’ Responsibilities in Relation to Financial Statements
- Chief Executive’s and Chief Financial Officer’s Statement of Responsibility
- Independent Auditors’ Report
- Income Statement
- Statement of Profit or Loss and Other Comprehensive Income
- Statement of Financial Position
- Statement of Changes in Equity
- Cash Flow Statement
- Notes to the Financial Statements
- Other Disclosures
- Supplementary
Information